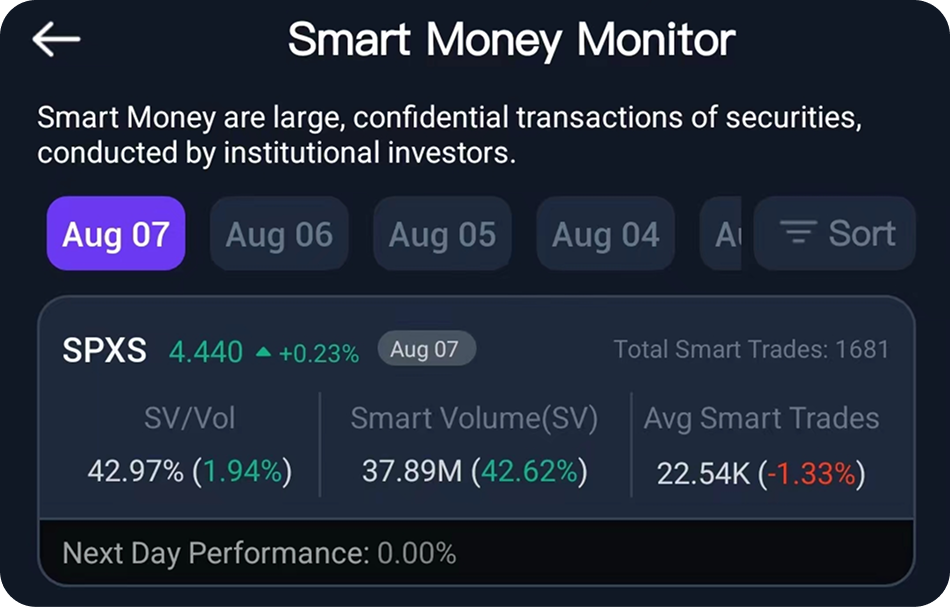
The smart money monitor, which is used to track the activities of institutions (regarded as the smart money), consists by 4 data:
1) Smart volume (sv): the volume traded by institutions
2) SV/Vol: the percentage of the institutional trading volume in the daily trading volume, which represents the level of eagerness.
3) Average smart trades: the sv divide the numbers of institutional trades, which represents the intensity of trading.A higher intensity means a higher determination.
4) The total smart trades is the numbers of institutional trades.
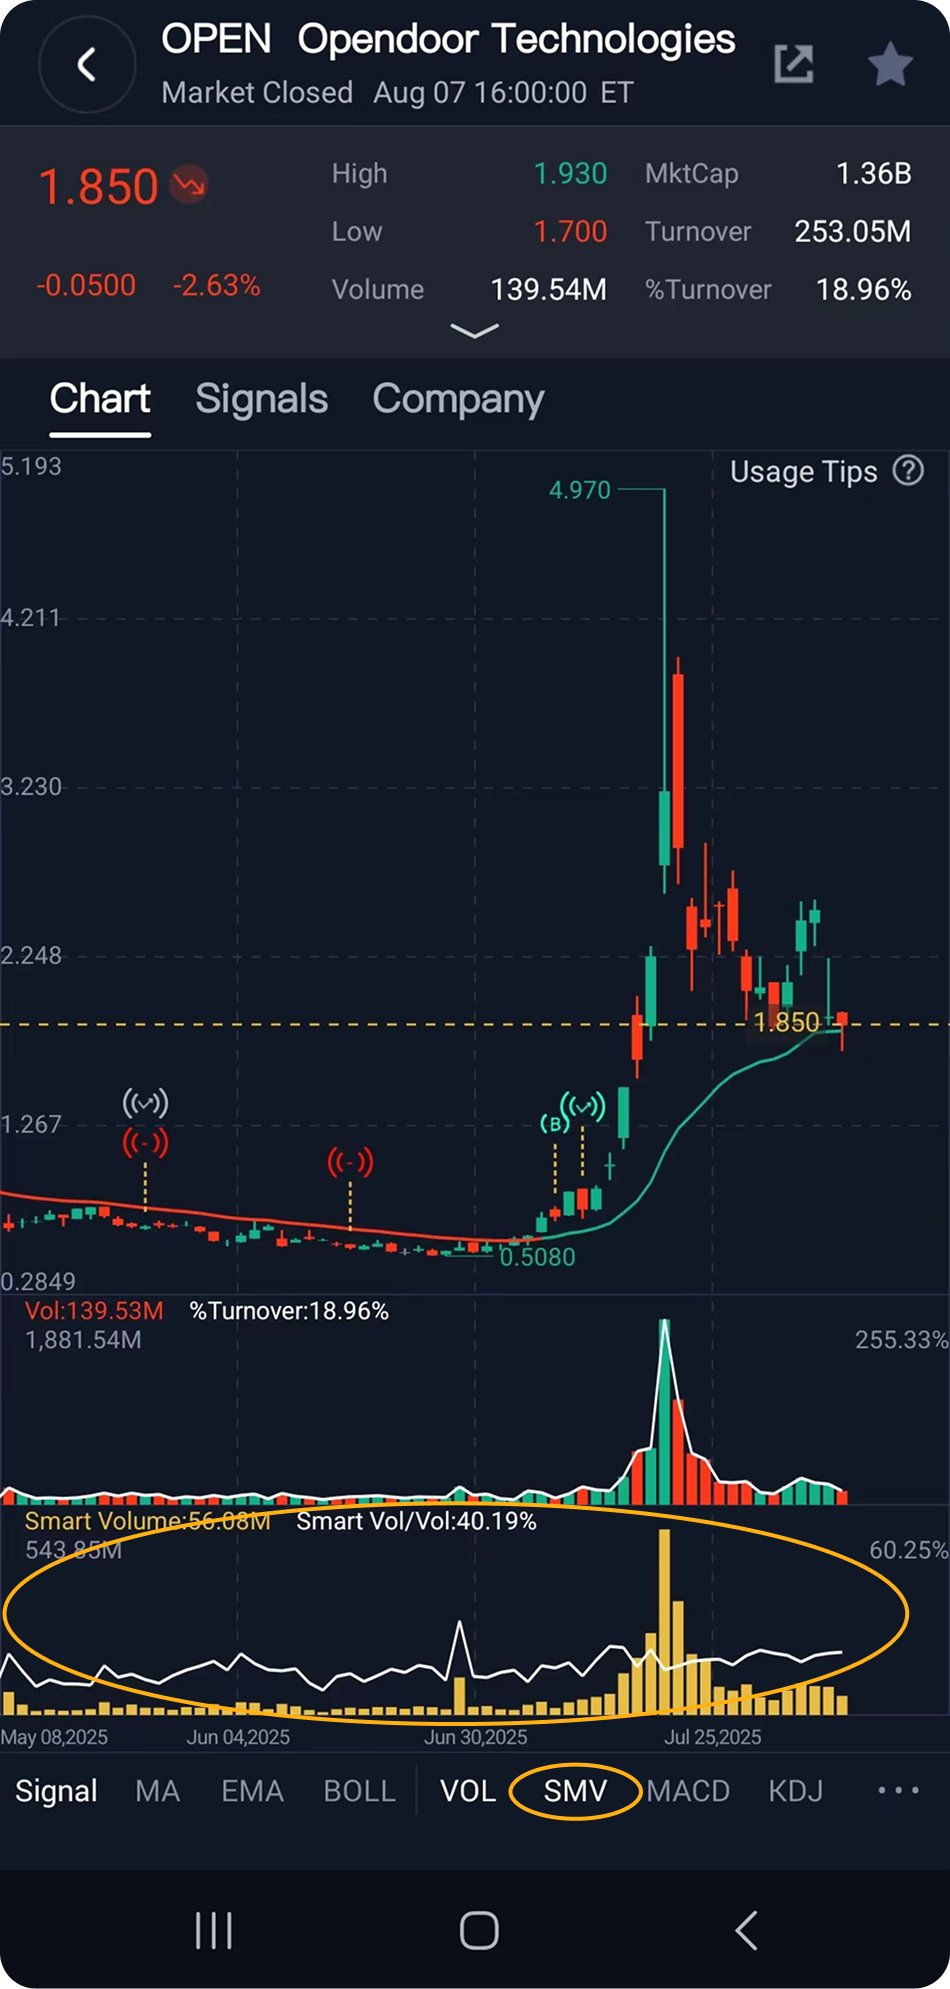
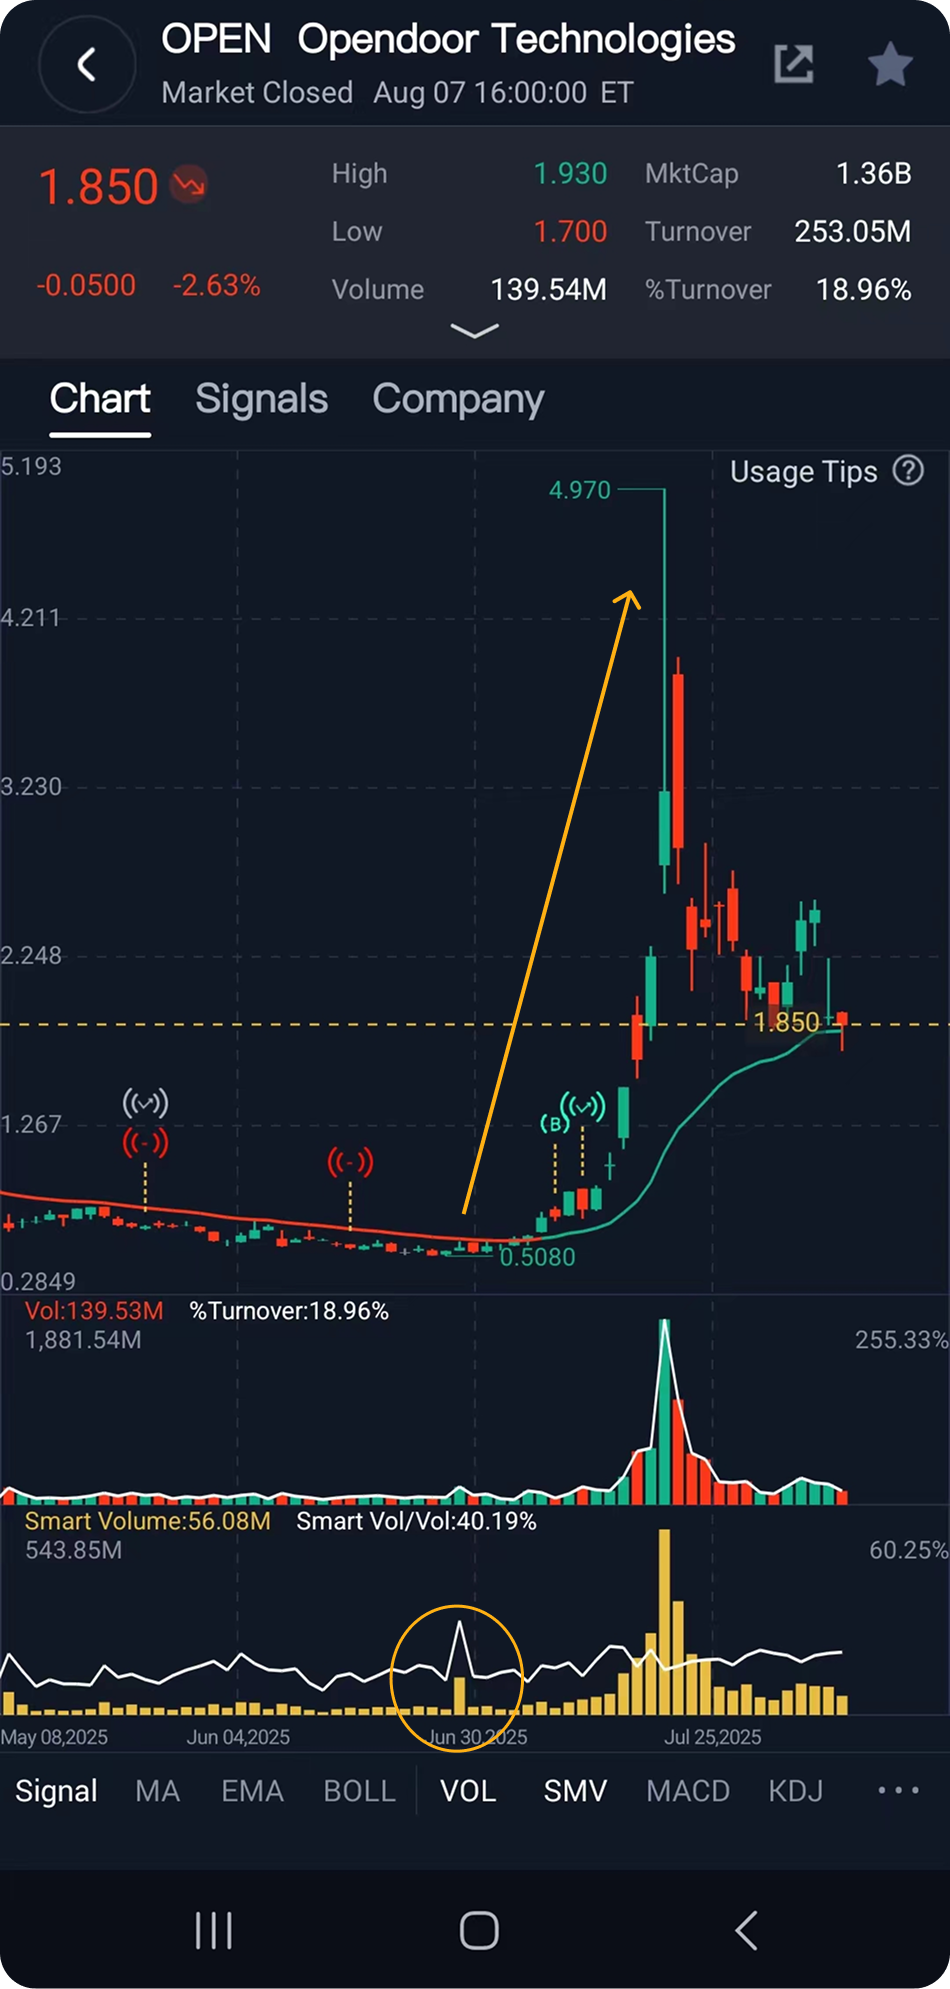
An indictor form of smart money is also provided in the subchart, by which you can figure out how the institutional trades influence the stock price trends.
Note: The data will be daily updated before premarket.

 service@qtmerla.com